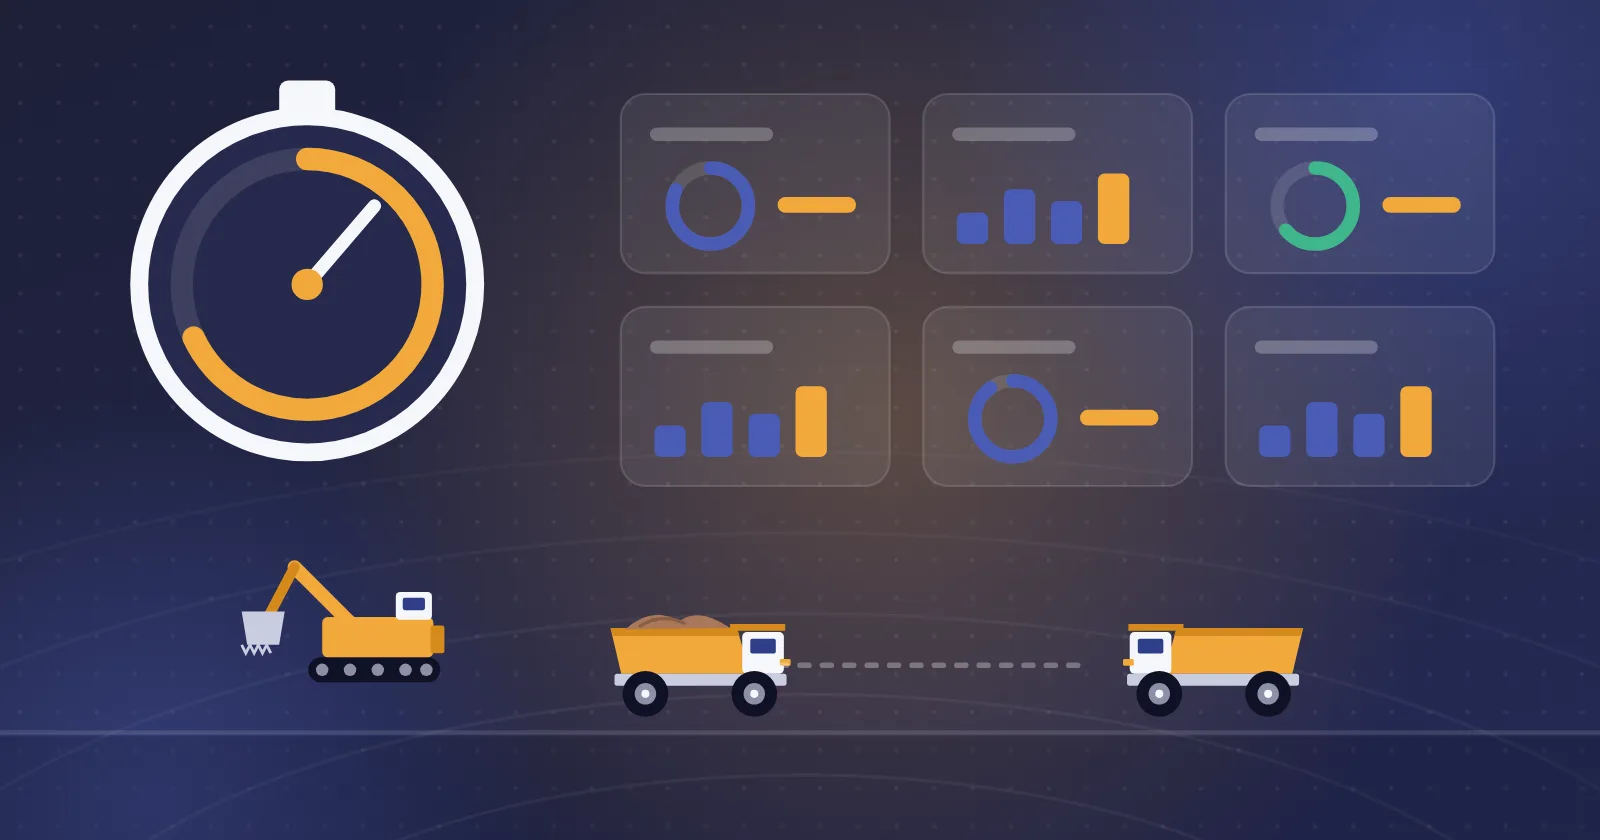
Rising haulage costs in a mine are not always caused by higher fuel prices or ageing machines. In many mining operations, part of the cost is hidden in underloaded trucks, overloading, idling, queues, inefficient routes, inconsistent loader pass counts and a lack of connection between production, fuel and fleet position data.
For example, when a haul truck is loaded below its target capacity, the mine needs more trips to move a given tonnage. Overloading, on the other hand, can increase stress on tyres, chassis, suspension and brakes. If the same machine then stands in the loading or dumping queue with its engine running, part of the fuel is burned without producing any tonnage.
Optimising haulage and fuel consumption in mines is therefore not achieved by installing a single sensor or looking at a dashboard. Mine managers need to analyse payload, position, route, cycle time, stoppage time, fuel use, engine status and operator performance together.
The ultimate goal of this integration is to turn scattered data into operational decisions that reduce unnecessary trips, increase the fleet's useful capacity and improve haulage cost per tonne.
Where do haulage costs in a mine come from?
Mine haulage is made up of interdependent activities. A disruption in any part of the load–haul–dump cycle can affect the other stages, so haulage cost analysis should not be limited to fuel delivered or the number of trips recorded.
Underloaded and overloaded haul trucks
Underloading occurs when a truck's payload is significantly below its defined target capacity. The machine still travels the haul route, the operator's time is used and wear occurs, but the tonnage moved is below the planned capacity.
Overloading creates a different problem. It can push gross vehicle weight beyond the permitted range and put more stress on tyres, suspension, brakes, chassis and drivetrain components. It can also slow the machine on ramps and lengthen cycle time.
Permitted payload limits should not be set as a single fixed percentage for every machine. Target capacity, maximum permitted weight and load distribution should be based on the machine model, body type, tyre specifications, road conditions and manufacturer guidance. Caterpillar's 10/10/20 policy, for example, recommends that average payload should not exceed the target, no more than 10% of loads should exceed 110% of target and no load should exceed 120%. Even this policy must be applied within the specifications of the equipment concerned and should not be generalised to every brand.
Waiting time, queues and idling
Not all stops are the same. For a correct analysis, distinguish between:
- Queue time: when the machine is in the loading or dumping queue.
- Standby time: when the machine is ready to work but has no assignment.
- Idle time: when the engine is running but the machine is doing no productive work.
- Engine-off waiting: a stop during which the engine is switched off.
- Delay: a delay caused by road damage, blasting, safety restrictions, shift changes or similar factors.
The goal is not to eliminate every stop. Some stops are necessary for safety, coordination or the process itself. The real task is to identify controllable stops and reduce non-productive idling.
Equipment manufacturers also treat idle time as an important machine management metric. Some OEM telemetry systems record position, operating hours, fuel use, productivity and idle time together, and newer machines may be able to shut the engine down automatically after a set period of idling.
Inefficient routes and poor fleet assignment
A truck may use the shortest route, but because of gradient, road surface or congestion, that route may not be the lowest-cost one. Route evaluation should consider the following as well as distance:
- Gradient and rolling resistance
- Road surface condition
- Speed limits
- Traffic density
- Number of stops
- Waiting time at the destination
- Fuel use loaded and empty
- Likelihood of blockages or diversions
Poor assignment of trucks to loaders or shovels can also create queues. If shovel loading capacity is not matched to the number and capacity of trucks, part of the fleet waits or the shovel is left without trucks.
Fleet management and dispatching systems are designed precisely to analyse these dependencies. Komatsu's DISPATCH system, for example, focuses on end-to-end monitoring of production equipment and reducing queue time through assignment and operational optimisation.
No integrated data on payload, fuel and operations
Seeing fuel consumption rise does not on its own reveal the cause. The increase may result from:
- Higher payload
- A longer route
- Road surface damage
- More idle time
- Poor operator behaviour
- Reduced engine performance
- Sensor error
- Unrecorded refuelling
- Unauthorised withdrawal
- A change in material type or dump location
Likewise, higher tonnage is not necessarily a sign of better performance. If higher tonnage comes with overloading, more wear or rising maintenance costs, cost per tonne may not improve in the long run.
An effective solution emerges when payload, fuel, position, assignment, operator, shift and cycle time data sit on a common timeline.
How is the loading and haulage cycle analysed?
The load–haul–dump cycle should be broken down into measurable events. Recording only the start and end of a trip is not enough to identify bottlenecks.
Waiting to load
At this stage, record when the truck enters the queue area, when loading starts, how many machines are waiting and which shovel or loader is the destination.
If queues recur at one point, the number of trucks assigned probably exceeds that point's loading capacity. If the shovel waits for trucks, there may be too few machines or the route's cycle time may have increased.
Loading and loader pass count
During loading, the following data matters:
- Loading start and end times
- Number of loader passes
- Weight of each pass
- Cumulative weight
- Final payload
- Operator
- Loader or shovel ID
- Loading location
- Material type
The number of passes should match the bucket capacity and the truck's target capacity. Too many passes lengthen loading time, while too few may cause underloading or uneven load distribution.
Hauling to the dump
On the haul road, record position, speed, gradient, stops, travel time, route changes and fuel consumption.
Simply comparing two operators' average speeds is not enough. Speed must be matched against payload, road conditions, safety limits and machine condition. Higher speed is not better performance in every situation.
Waiting and dumping
At the dump, record arrival time, waiting time, dumping duration, destination, material type and whether the dump was correct.
Longer queue time at the dump may be caused by crusher constraints, congestion, equipment stops at the destination or poor fleet assignment.
Empty return
On the return trip, the truck travels empty, but it still consumes time, fuel and fleet operating capacity.
The return route, speed, stops and arrival time at the loading point should be measured separately. Combining loaded haul and empty return times into one figure hides the cause of longer cycle times.
Refuelling and ancillary stops
Events such as refuelling, scheduled servicing, breakdowns, operator changes, blasting delays and shift changes should be separated from the production cycle.
If unplanned refuelling happens during peak production, it can disrupt the balance of the whole fleet as well as costing the machine's own time. Recording the cause of each stop accurately prevents operational delays from being mistaken for breakdowns or idling.
What is an integrated loading and fuel control system?
An integrated loading and fuel control system is a combination of sensors, telemetry equipment, communication infrastructure and analytical software that collects fleet production and consumption data and turns it into operational action.
Such a system usually has three main layers:
- Collecting data from machines and operating points
- Transmitting, storing and validating information
- Analysing, alerting and following up corrective action
Data the system needs
Depending on the equipment and project goals, the following data can be collected:
- Payload and weight of each pass
- Number of loading passes
- Position and route
- Speed
- Engine RPM
- Engine status
- Engine hours
- Fuel level
- Fuel flow
- Idle time
- Haul cycle events
- Operator and shift
- Loading location
- Dump location
- Material type
- Assigned task
- Fault codes and machine health status
For example, OEM systems such as Caterpillar's TPMS can record payload, cycle time and distance, and Komatsu's remote monitoring systems provide data such as machine performance, component health, fuel, payload and idle time.
How data is collected
On newer machines, some information can be read from the ECU and CAN bus. The advantage is using the machine's internal data and needing fewer add-on sensors. The type and level of data access, however, differ between brands and models.
On older machines or equipment that does not provide enough ECU data, independent sensors, GPS, flow meters, tank level sensors and operator input can be used.
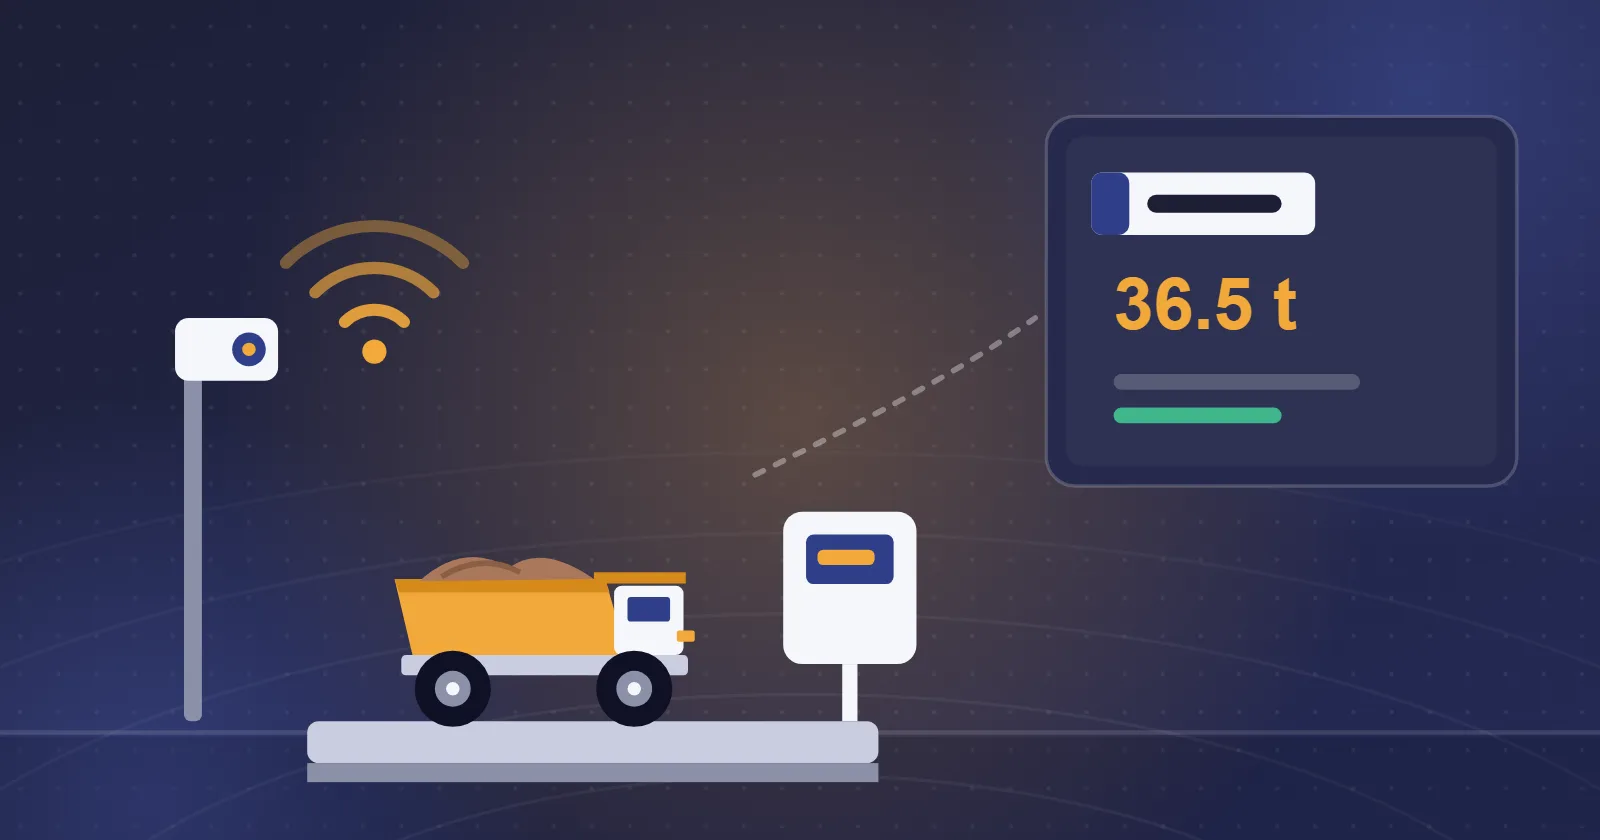
Weighbridge data can also be connected to validate the weight hauled. On-board payload monitoring and a fixed weighbridge are two different sources, and reconciling them can help check for errors or calibration issues.
Transmitting and storing information
Depending on site infrastructure, data can be transmitted over LTE, industrial Wi-Fi, a radio network or a private network.
In mines without full coverage, equipment must be able to store data locally and resend it once the connection is restored. Bistun Kavir's fleet tracking and smart weighbridge systems also list offline recording and synchronisation after reconnection among their operational capabilities.
Turning raw data into operational action
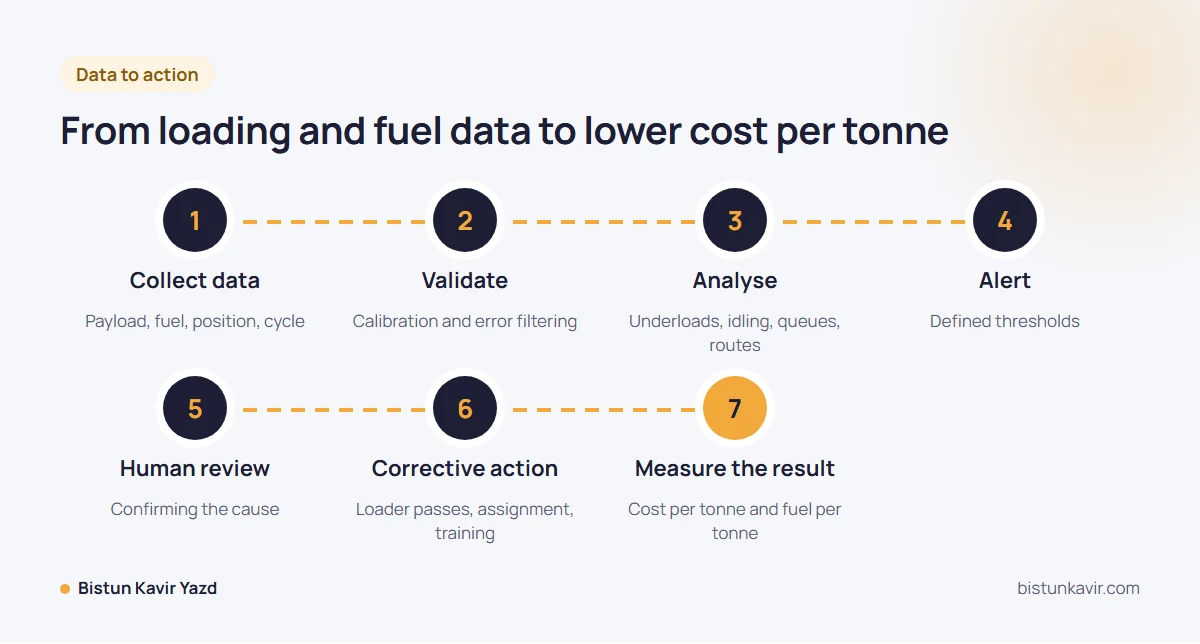
Data alone does not reduce costs. A complete process should cover the following steps:
Data collection → validation → analysis → alert → human review → corrective action → measuring the result
For example, if the system records a sudden drop in fuel level, it should not immediately be treated as theft. The event must be matched against position, engine status, ground slope, the time of the last refuelling and previous sensor changes.
Payload monitoring, smart weighbridges and mine dispatching compared
These systems may produce related data, but they do not replace one another.
Payload monitoring system
A payload monitoring system is installed on a haul truck, loader or shovel and estimates or measures the load weight during loading.
Its main uses are:
- Controlling underloading and overloading
- Measuring the weight of each pass
- Calculating cumulative payload
- Analysing pass counts
- Comparing operators and shifts
- Telling the loader operator when to stop loading
The system allows the load to be corrected before the truck moves off.
Smart weighbridge system
A weighbridge sits at a fixed point and records vehicle weight as it passes or stops.
A smart weighbridge system can manage:
- Tare weight
- Gross weight
- Net weight
- Licence plate
- Entry and exit times
- Load type
- Contractor
- Weighing ticket
- Access permit
In Bistun Kavir's smart weighbridge solution, weighing is integrated with plate recognition, barriers, data recording and management reports. The system can also connect to dispatching, ERP and SCADA.
Fuel management system
A fuel management system focuses on the chain of receiving, storing, delivering and consuming fuel.
It can cover:
- Monitoring tank stocks
- Recording incoming fuel
- Measuring volumes delivered
- Identifying the receiving machine
- Allowance control
- Recording refuelling time and location
- Detecting discrepancies
- Alerting on abnormal drops
Bistun Kavir's fuel management solution uses data such as level sensors, flow meters, GPS and plate recognition to control delivery and consumption, and is designed to connect to the weighbridge, fleet and dispatching systems.
Dispatching and fleet management system
Dispatching focuses on assigning machines and coordinating operations. It decides which shovel, route or dump each truck should be sent to.
Its main features can include:
- Assigning trucks to shovels
- Queue management
- Route monitoring
- Cycle time control
- Route deviation checks
- Shift performance analysis
- Task management
- Comparing machines and operators
Bistun Kavir's BiSmart system covers fleet management, dispatching, GPS tracking, reporting, planning and operational alerts in one integrated structure.
The value of integrating these systems
Suppose a truck's fuel consumption rose during a shift. The fuel system shows the increase, but to find the cause other questions must be answered:
- Has the machine's payload increased?
- Has the route changed or got longer?
- Has idle time increased?
- Was the machine stopped in the dump queue?
- Was abnormal speed or RPM recorded?
- Was there unscheduled refuelling?
- Is there a loss of technical performance?
- Does the sensor need calibration?
An accurate answer comes when payload, fuel, tracking and dispatching data sit on a shared dashboard or analytics platform.
Find out which part of your mine's operations causes the most fuel and time loss.
How does payload control improve loading productivity?
Measuring the weight of each loading pass
In systems installed on loading equipment, the weight of each bucket or pass is measured and added to the truck's cumulative weight.
Before loading is complete, the operator can see how far the truck is from its target capacity. This reduces the likelihood of underloading or overloading and makes pass counts more consistent.
Detecting underloading and overloading
Three values should be defined for each machine model:
- Target payload
- Acceptable operating range
- Maximum permitted weight
These limits should be consistent with rated payload, gross vehicle weight, body specifications, tyre type, road conditions and the manufacturer's policy.
The alert system should also distinguish between a minor deviation, an off-target load and a critical overload. Over-sensitive alerts can make operators distrust the system and ignore important messages.
Analysing operator and shift performance
Operators should not be evaluated on average payload alone. The following indicators give a more accurate picture:
- Average payload
- Payload variability
- Percentage of compliant loads
- Number of overloads
- Number of underloads
- Average pass count
- Loading time
- How often loads are corrected
- Recurring errors
An operator with a good average payload but high variability is not performing consistently. Loading consistency matters a great deal for fleet planning.
The effect of payload on cost and wear
Underloading increases the number of trips needed to move a given tonnage. Overloading can affect component life, speed on ramps, fuel consumption and cycle time.
The aim of payload optimisation is not to carry the heaviest possible load in every situation, but to achieve a consistent, safe distribution within the machine's target range.
How is mining equipment fuel consumption monitored?
Fuel level sensors, flow meters and the ECU
No single measurement method suits every application.
A fuel level sensor records changes in the liquid level inside the tank and is used to monitor stock, detect refuelling and identify sudden drops. Tank shape, fuel movement, machine tilt and sensor installation can all affect the data.
A flow meter measures the volume passing through a fuel line or dispensing equipment. It is widely used to record volumes delivered at a tank or fuel station but requires correct installation and calibration.
ECU or CAN bus data can provide consumption figures calculated by the machine's own systems. Access, available parameters and accuracy are not the same across models.
In sensitive projects, using several data sources and reconciling them can increase the reliability of reports.
Recording refuelling events
Each refuelling event should include at least:
- Machine ID
- Operator ID
- Time
- Location
- Volume delivered
- Fuel source or tank
- Level before and after refuelling
- Shift
- Contractor
- Allowance
- Dispensing equipment ID
If delivered fuel is recorded but the receiving machine or location is not, a complete audit is not possible.
Detecting sudden drops and unauthorised withdrawal
A drop in fuel level is a signal, not definitive proof of unauthorised withdrawal. To reduce false positives, the event should be matched against:
- Whether the engine was on or off
- Machine location
- Slope at the stopping point
- Speed
- Time of the event
- Last refuelling
- Size of the level change
- Duration of the drop
- History of similar events
- Machine movement before and after the drop
If the drop occurred while stationary, on fairly level ground, with the engine off and no recorded event, further investigation becomes more warranted.
Analysing consumption under different operating conditions
Total daily consumption should be broken down by operating state:
- Hauling loaded
- Returning empty
- Loading
- Waiting in queues
- Dumping
- Idling
- Moving without a task
- Refuelling
- Maintenance and testing
This breakdown shows how much fuel was used to produce tonnage and how much was spent on non-productive activities.
Common errors in fuel and payload monitoring
Fuel sloshing in the tank
Machine movement, acceleration, braking and road gradient make the fuel level move inside the tank. A momentary change in the sensor reading should not be recorded directly as refuelling or withdrawal.
Time filtering, analysing movement status and defining a minimum event duration help reduce false alerts.
Incorrect calibration
Mining equipment tanks are rarely perfectly regular in shape, so converting liquid height to volume must use a calibration table specific to that tank.
Payload calibration should also be checked against a reliable reference such as a weighbridge or known weights. Body changes, suspension repairs or sensor replacement may require recalibration.
Network outages
Loss of connection should not mean lost data. The device should store information with an accurate timestamp and send it to the server once the network is restored.
The dashboard should also clearly distinguish between "no event" and "no data received".
ECU data versus independent sensors
ECU data depends on the machine's internal architecture and may be incomplete or inaccessible for some models. Independent sensors allow retrofitting, but their quality depends on equipment choice, mounting position and calibration.
The method should be chosen after a technical review of each machine model, not as a single solution for the whole fleet.
Operator errors and manual entry
Manual data entry can be late, forgotten or incorrect. At the same time, removing human input entirely is not always possible.
Information that can be captured automatically is best recorded by the system, with manual entry used only to record causes, confirm events or handle exceptions.
Key loading, haulage and fuel KPIs
A KPI should lead to a specific decision. Showing many charts without assigning an owner and a corrective action for each indicator creates little operational value.
Haulage cost per tonne
This indicator divides the total cost of haulage by the actual tonnage moved:
Cost per Ton = Total Haulage Cost ÷ Total Tonnes Moved
Total cost can include fuel, labour, tyres, maintenance, parts, depreciation and downtime costs.
Lower fuel consumption does not necessarily reduce cost per tonne. If tonnage drops at the same time, the cost of each tonne may rise.
Fuel per tonne
Fuel Intensity = Total Fuel Consumed ÷ Total Tonnes Moved
This indicator shows how much fuel was used to move each tonne of material.
For a more detailed analysis, fuel intensity can be calculated by route, shift, machine, operator, material type and dump location.
Payload compliance
Payload Compliance = Compliant Trips ÷ Total Trips × 100
Before calculating it, the compliant load range must be defined based on the machine's specifications.
A high value shows that most trips were loaded close to target, but it should be analysed together with average payload and payload variability.
Payload variability
Two shifts may have the same average payload, but one may produce loads close to target while the other produces a mix of underloads and overloads.
Standard deviation, range or a payload distribution chart can show how consistent the loading process is.
Cycle time
Cycle time is best broken down into the following components:
Cycle Time = Queue + Spot + Load + Haul + Queue at Dump + Dump + Return
This breakdown shows in which part of the cycle the increase occurred.
Idle time and idle fuel
Idle Percentage = Idle Time ÷ Engine-On Time × 100
Alongside the idle percentage, the fuel used while idling should also be reported. Two machines with the same idle time may consume different amounts because of engine power, RPM or ambient conditions.
Tonnes per operating hour
Tonnes per Operating Hour = Total Tonnes ÷ Productive Operating Hours
The denominator should be productive hours, not the total calendar time of the shift.
Availability and utilisation
Availability shows what share of scheduled time the machine was technically ready to work.
Utilisation shows what share of available time the machine was actually used.
A machine may have high availability but low utilisation because of no operator, poor planning or waiting for assignments.
Example calculation: the effect of underloading and idling on mine costs
The following example is entirely hypothetical and is only intended to show the calculation method. Real results depend on the machine type, route, costs and site conditions.
Starting point
Suppose a mine has 20 haul trucks with a target capacity of 90 tonnes. Each machine makes 12 trips a day, so total daily trips are 240.
The actual average payload is 82 tonnes and the fleet's daily fuel consumption is 18,000 litres.
Daily tonnage:
240 × 82 = 19,680 tonnes
Fuel intensity:
18,000 ÷ 19,680 = 0.915 litres per tonne
We also assume that 18% of engine-on time is recorded as idling and that the total daily haulage cost is 3 billion rials.
Haulage cost per tonne:
3,000,000,000 ÷ 19,680 = 152,439 rials
Sources of loss
Data analysis shows that:
- Some trucks are consistently underloaded.
- Pass counts are inconsistent between operators.
- Queues form at the dump.
- Part of the idling during shift changes and waiting is controllable.
- Fleet assignment is not matched to shovel capacity.
Hypothetical result after corrections
After correcting pass counts, training operators, changing fleet assignment and reducing unnecessary stops, average payload rises to 88 tonnes. With the same 240 trips, daily tonnage becomes:
240 × 88 = 21,120 tonnes
Daily tonnage has risen by about 7.3%.
If fuel consumption falls to 17,100 litres thanks to less idling:
17,100 ÷ 21,120 = 0.810 litres per tonne
Fuel intensity has fallen by about 11.5%.
If total daily cost falls from 3 billion to 2.955 billion rials because of lower fuel consumption:
2,955,000,000 ÷ 21,120 = 139,915 rials per tonne
In this hypothetical example, cost per tonne has fallen by about 8.2%. Most of this improvement does not come from fuel savings alone; more useful tonnage from the same number of trips also plays a major role.
Steps for implementing the system at a mine
Set the baseline
Before installing the system, define the baseline. Collect at least several weeks of comparable data on payload, tonnage, fuel consumption, cycle time, idling and availability.
Without a baseline, proving the project's results and calculating return on investment will be difficult.
Select pilot machines
For the pilot, it is best to choose machines that:
- Are heavily used.
- Account for a large share of haulage cost.
- Work on defined routes.
- Have data that can be validated.
- Operate in varied conditions.
- Have operators and maintenance staff who are available.
Starting with highly unusual or rarely used machines may make the pilot results impossible to generalise.
Review the infrastructure
Before choosing equipment, review:
- Machine model and year of manufacture
- Access to the ECU and CAN
- Existing GPS
- Installed sensors
- Power supply
- Network coverage
- Local or cloud servers
- Existing dispatching and ERP systems
- Information security requirements
- Temperature, dust and vibration conditions
Define thresholds
Alert thresholds should be defined for each equipment type and event:
- Underloading and overloading
- Long idling
- Abnormal fuel drops
- Speeding
- Stops outside designated areas
- Route deviation
- Abnormal cycle time
- Unscheduled refuelling
During the pilot, these limits may be adjusted several times to balance sensitivity against false alerts.
Install and calibrate
After installation, sensor data must be compared against a reliable reference. Testing should cover different conditions such as full and half-full tanks, ramps, varying loads and several shifts.
A device switching on or data appearing on a dashboard does not mean commissioning is complete.
Train the operations team
Operators, dispatchers, fuel staff, maintenance and shift managers should know:
- What each alert means.
- Who is responsible for reviewing it.
- What action must be taken.
- Where the result of the action is recorded.
- Which conditions invalidate an alert.
Evaluate the pilot
Before and after KPIs must be reviewed under comparable conditions. Changes in route, material type, number of active machines or production plan must be taken into account.
Return on investment can be calculated from fuel savings, higher tonnage, fewer stoppages, fewer discrepancies and maintenance savings.
Roll out to the whole fleet
Once the technical and economic case is proven, rollout is best done in stages. A phased rollout makes it possible to manage calibration, training, data quality control and the improvement of operational processes.
To run a loading and fuel control pilot, the mine's infrastructure and machines must first be assessed.
Does the system work on older machines and mixed fleets?
On newer machines, some data can usually be read from the ECU or CAN bus. Older machines may require GPS, independent fuel sensors, flow meters or other add-on equipment.
In a mixed fleet, each brand's data structure is different. Some machines provide payload and fuel rate, while others only give the system a limited number of parameters.
Before promising full compatibility, check the following for each model:
- Accessible parameters
- Communication protocol
- Need for independent sensors
- Calibration method
- Power supply
- Installation space
- Warranty conditions
- Ability to connect to the central platform
A suitable system should convert data from different brands into a comparable structure, but the installation method and level of data will not be the same for every machine.
When does a mine need an integrated system?
Several of the following signs may indicate the need for a closer assessment:
- Fuel consumption has risen but production has stayed flat.
- Production reports disagree with weighbridge data.
- Many loads are underloaded or overloaded.
- Long queues form at loading or dumping points.
- Idle time varies widely between shifts.
- Fuel allowances do not match recorded consumption.
- Managers have no access to real-time information.
- Reports depend on manual entry.
- Operator performance cannot be compared.
- Maintenance costs have risen for no clear reason.
- Haul routes change frequently.
- The fleet includes different brands and models.
- The cause of rising cost per tonne is unclear.
Criteria for choosing the right system
Compatibility with existing equipment
The system should be assessed against the machine models, current systems and site network before final purchase.
Accuracy and calibration
It must be possible to calibrate, view sensor status and record the history of changes.
Offline operation
Data must not be lost during network outages. Event timestamps must also reflect when the event happened, not when the data was resent.
ERP and SCADA integration
API output, data exchange and a shared ID structure are important to avoid creating information silos.
Integration with dispatching and the weighbridge
Payload, weighbridge, assignment, fuel and position data must be matchable by machine, time and trip.
Actionable reports
A report should show what happened, where, which machine was involved and what action is needed.
Data security and ownership
User access levels, backups, storage location, encryption and data ownership should be defined from the start.
Support and training
Calibration, equipment repairs, user training and refining alert rules are part of the project and should not be limited to delivering hardware.
Scalability
The system should allow new machines, sensors, sites, analytics modules and connections to future systems to be added.
Conclusion: reducing haulage costs through data-driven decisions
Loading data alone does not explain why fuel consumption has risen. Fuel data without payload, route and cycle time cannot show the cause of losses either. GPS position becomes more valuable operationally when it is linked to the task, load type, loading point and dump destination.
Integrating loading, haulage and fuel data helps mine managers carry out three steps continuously:
- Identify where losses occur.
- Take appropriate corrective action.
- Evaluate the result of that action with measurable KPIs.
The ultimate goal is not more sensors or dashboards. It is for the mine to move more tonnage with fewer trips, less fuel, less downtime and lower operating cost.
Reducing haulage costs starts with pinpointing where losses occur. To review your mine's loading, fuel and fleet data, get in touch with Bistun Kavir's specialists.
Frequently asked questions
What is the difference between payload monitoring and a smart weighbridge?
Payload monitoring is usually installed on a haul truck, loader or shovel and measures or estimates load weight during loading, allowing the operator to correct underloading or overloading before moving off. A smart weighbridge sits at a fixed point and records the vehicle's tare, gross and net weight. The two can be connected for validation and tighter control.
How does the system detect unauthorised fuel withdrawal?
The system identifies abnormal drops by analysing tank level changes, time, location, engine status and the last refuelling event. A drop in fuel level alone is not proof of unauthorised withdrawal, because slope, machine movement or sensor error can also change the recorded value. A credible alert should be sent to the responsible person only after several data sources have been reconciled.
Can the system be installed on older machines?
On many older machines, add-on equipment such as GPS, fuel level sensors, flow meters or digital inputs can be used. The type of data and achievable accuracy, however, depend on the machine model, electrical system, tank shape and installation options. A technical inspection or review of each model's specifications should be carried out before confirming compatibility.
What happens if the internet goes down?
Suitable equipment should store information in internal memory and, once the connection is restored, send it to the server with the real event time. The dashboard should also show the outage so users do not mistake missing data for no activity. Memory capacity and the supported offline period should be defined in the project design.
Which machines should a pilot usually start with?
A pilot is best run on heavily used machines that have a large effect on cost. Trucks working on defined routes, whose payload and fuel data can be validated, are good candidates. Choosing highly unusual, very worn or rarely used machines may make the pilot results unreliable for rolling out to the whole fleet.
How is the project's return on investment calculated?
First, baseline KPIs such as fuel intensity, cost per tonne, idle time, payload compliance and cycle time are recorded. After the pilot, changes in these indicators are converted into financial value. Fuel savings, higher tonnage, fewer stoppages, fewer discrepancies and lower maintenance costs can all be included, and the results compared with the cost of equipment, installation, support and training.
Can the system's data be sent to ERP or SCADA?
With a suitable API or interface, data such as fuel, weight, tonnage, machine operation and operational events can be transferred to ERP, SCADA or maintenance software. Before implementation, shared machine IDs, data format, transmission frequency, access levels and each system's responsibilities should be defined to avoid duplicate or conflicting information.
What is the most important KPI to start with?
There is no single KPI for every mine. If the main problem is loading, payload compliance and payload variability are good starting points. In fuel projects, fuel intensity and idle fuel matter more. For fleet assignment problems, cycle time components and queue time should be reviewed. The initial KPI should relate directly to the mine's financial or operational problem.
How is sensor error distinguished from a real fuel drop?
The system should match fuel level changes against movement status, slope, position, engine status, time and the sensor's previous pattern. A short drop while moving is usually caused by fuel sloshing, while a sustained drop while stationary needs further investigation. Correct calibration, software filtering and multiple data sources reduce the chance of false alerts.
Can one system manage a mixed-brand fleet?
Yes, provided the platform can receive data from different protocols and equipment. The level of accessible information is not the same across brands, though. ECU data may be enough for one machine, while another needs an independent sensor. Separate technical assessment and calibration of each model is essential for comparable reports.