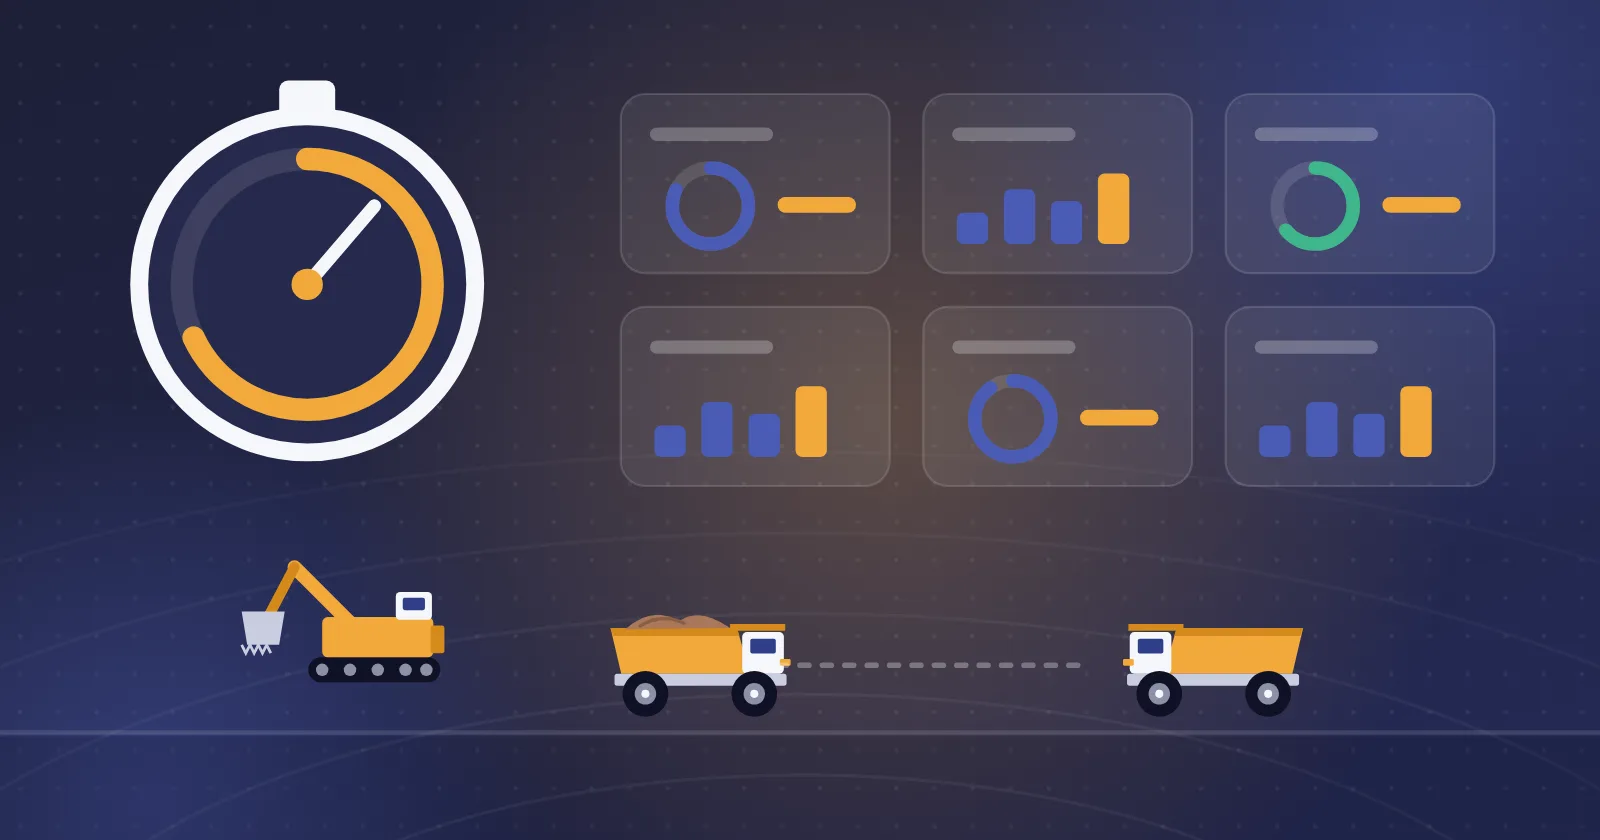
In mining and haulage operations, the number of active machines or equipment operating hours alone does not show whether a mine is performing well.
A fleet of dump trucks may be running for the whole shift yet spend a large share of that time queuing at the shovel, waiting to dump or in unnecessary stops. In that situation, more machine hours do not necessarily mean more production.
Managing a mining fleet effectively requires measuring indicators that show the relationship between time, equipment capacity, production volume and operating cost.
These are known as mining fleet key performance indicators (KPIs), and they help managers find operational bottlenecks and make better-informed decisions.
Why does measuring KPIs matter in mining fleet management?
Mine haulage is made up of several linked activities. The truck positions at the loading point, takes its load, travels to the destination, dumps and returns for the next cycle.
A disruption at any of these stages can affect the performance of the whole haul cycle.
For example, adding more trucks is not always the right way to increase production. If the shovel's loading capacity is limited, more trucks may simply lengthen the queue.
On the other hand, if the shovel spends a lot of time waiting for trucks to arrive, the problem probably lies in fleet allocation or haulage capacity.
Measuring KPIs helps the mine manager analyse what is actually happening in the operation rather than relying on personal impressions.
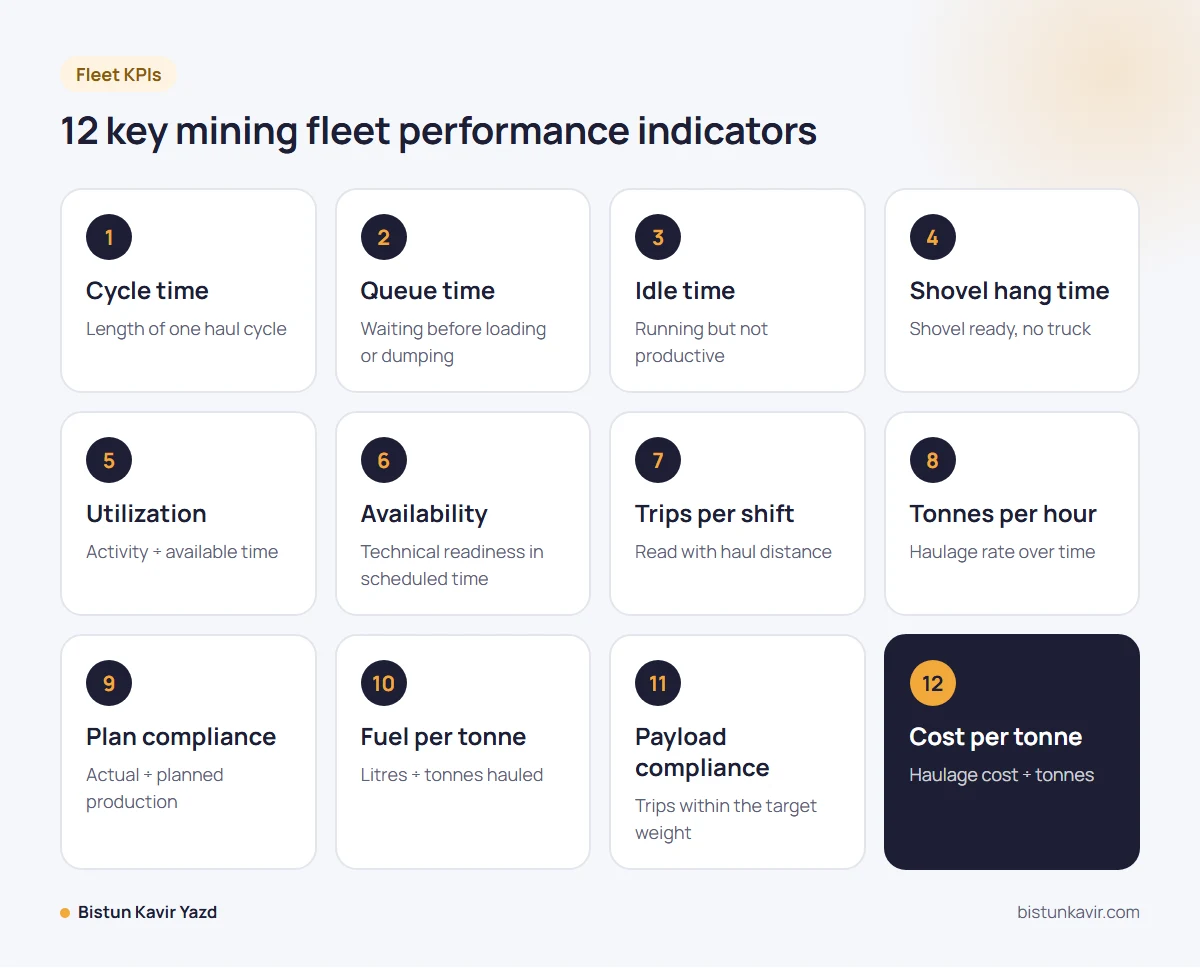
1. Haul cycle time
Cycle time is one of the most important performance indicators for haul trucks in open-pit mines.
It shows how long it takes to complete one operating cycle. The cycle usually starts at a defined point and ends after loading, travelling, dumping and returning to that point or stage.
The components of a haul cycle may include queuing for loading, loading, travelling loaded, queuing to dump, dumping and returning empty.
Formula:
Cycle Time = sum of the durations of all stages of one haul cycle
For example, suppose a dump truck has the following times in one cycle:
- Queuing for loading: 4 minutes
- Loading: 5 minutes
- Travelling loaded: 12 minutes
- Dumping: 3 minutes
- Returning empty: 10 minutes
In this case, the total cycle time is 34 minutes.
Under the same conditions, and without compromising safety or quality, a shorter cycle time can create capacity for more trips.
When comparing cycle times, however, haul distance, road grade, machine type and road conditions must be taken into account.
2. Queue time
Queue time is how long a haulage machine waits before it is served—for example, before being loaded at the shovel or dumping at the crusher.
A rise in this indicator may point to an unbalanced truck allocation, limited loading capacity or a bottleneck at the dump point.
Suppose several trucks are assigned to one shovel at the same time. If the shovel cannot serve them at the same pace, a queue forms and part of the fleet's time capacity is lost.
Average queue time formula:
Average Queue Time = total vehicle waiting time ÷ number of waiting events
To reduce this indicator, the dispatch manager should review how machines are distributed between loading and dump points.
3. Idle time
In many fleet management systems, idle time refers to time when a machine is running but not doing the intended productive work.
For example, a dump truck may be stationary somewhere with its engine still running.
This can lead to fuel being burned without matching production, more engine hours and higher operating costs.
Not all stops are unnecessary, however. Some may be needed for safety, traffic control or operational procedures.
That is why it is better to split stops into categories such as planned stops, operational waiting and unnecessary stops.
Sample formula for the share of idling:
Idle Ratio = idling time ÷ engine-on time × 100
When analysing this indicator, the definition of idle must be the same across all equipment.
4. Shovel hang time
This indicator shows the time when the shovel is ready to load but has no suitable truck to load.
Shovel hang time can increase because of insufficient haulage capacity, poor equipment allocation or trucks returning late.
For example, if the shovel is ready to work but the trucks are held up on long routes or in the dump queue, its loading capacity goes unused.
The operations manager should review this indicator together with queue time.
A long queue at one shovel while another shovel waits for trucks can be a sign of an unbalanced fleet distribution.
5. Fleet utilization
Utilization shows what share of the equipment's available time has been spent on the intended operating activity.
It is used to check how effectively equipment capacity is being used.
Suggested formula:
Utilization = operating activity time ÷ available time × 100
Suppose a dump truck is technically available for 10 hours during a shift and has 7 hours of recorded operating activity.
In that case, its utilization is 70 percent.
Note that the definition of "operating activity" may differ between mines. Some organisations use travel time, some effective production time and some a set of operating states as the numerator.
Utilization comparisons are therefore valid only when the definition is the same and documented.
6. Equipment availability
Availability is one of the key indicators for the maintenance department and equipment management.
It shows what share of the scheduled time a machine was technically ready for use.
A common definition of mechanical availability:
Mechanical Availability = (scheduled time − maintenance downtime) ÷ scheduled time × 100
For example, if a machine is out of service for 8 hours of maintenance out of 100 scheduled hours, its mechanical availability is 92 percent.
High availability does not necessarily mean high utilization.
A machine may be technically ready but see little use because there is no assignment for it or operations are constrained.
Looking at both indicators together helps managers separate technical problems from operational constraints.
7. Trips per shift
The number of trips completed by dump trucks is one of the simplest and most practical haulage indicators.
It makes it easy to see how equipment performance changes from shift to shift.
On its own, however, the number of trips is not enough to measure productivity.
For example, a truck working on a short route will naturally complete more trips than a similar truck on a long route.
Comparisons should therefore take haul distance, payload capacity, material type and route conditions into account.
8. Tonnes per hour
This indicator is used to evaluate the rate of production or material haulage over a given period.
Formula:
Tonnes per Hour = tonnes hauled ÷ base time in hours
Suppose the total material moved in an 8-hour shift is 2,400 tonnes.
The average haulage rate is then 300 tonnes per hour.
It must be clear, though, whether the time base is the whole shift or only effective production time, because a different denominator gives a different result.
Together with cycle time and fleet utilization, this indicator gives a better picture of operational performance.
9. Plan compliance
Plan compliance measures how closely the mine's actual performance matches the operating plan.
It can be used to assess tonnage, haul destinations, material type or completed assignments.
For example, if a shift's production plan is to move 5,000 tonnes and 4,500 tonnes are recorded, plan tonnage achievement is 90 percent.
Plan tonnage achievement formula:
Production Plan Achievement = actual production ÷ planned production × 100
The important point is that achieving plan tonnage is not the same as compliance with routes, material quality or destinations. A separate indicator should be defined for each of these.
10. Fuel per tonne
Fuel is one of the main costs of hauling mined material.
Looking at total fuel consumed without considering production does not give a complete picture of energy efficiency.
The fuel per tonne indicator shows how much fuel is used for each tonne of material hauled.
Formula:
Fuel per Ton = total fuel consumed in litres ÷ tonnes hauled
For example, if the fleet uses 6,000 litres of fuel and hauls 12,000 tonnes of material over a period, average consumption is 0.5 litres per tonne.
This indicator should be interpreted in light of haul distance, elevation difference, equipment capacity and route type.
Calculating it reliably requires dependable fuel consumption and tonnage data.
11. Payload compliance
Load weight is one of the factors that affect haulage productivity and safety.
Payload compliance measures what share of trips were completed within the target weight range or defined permissible capacity.
Sample formula:
Payload Compliance = trips with an acceptable weight ÷ trips with valid weight data × 100
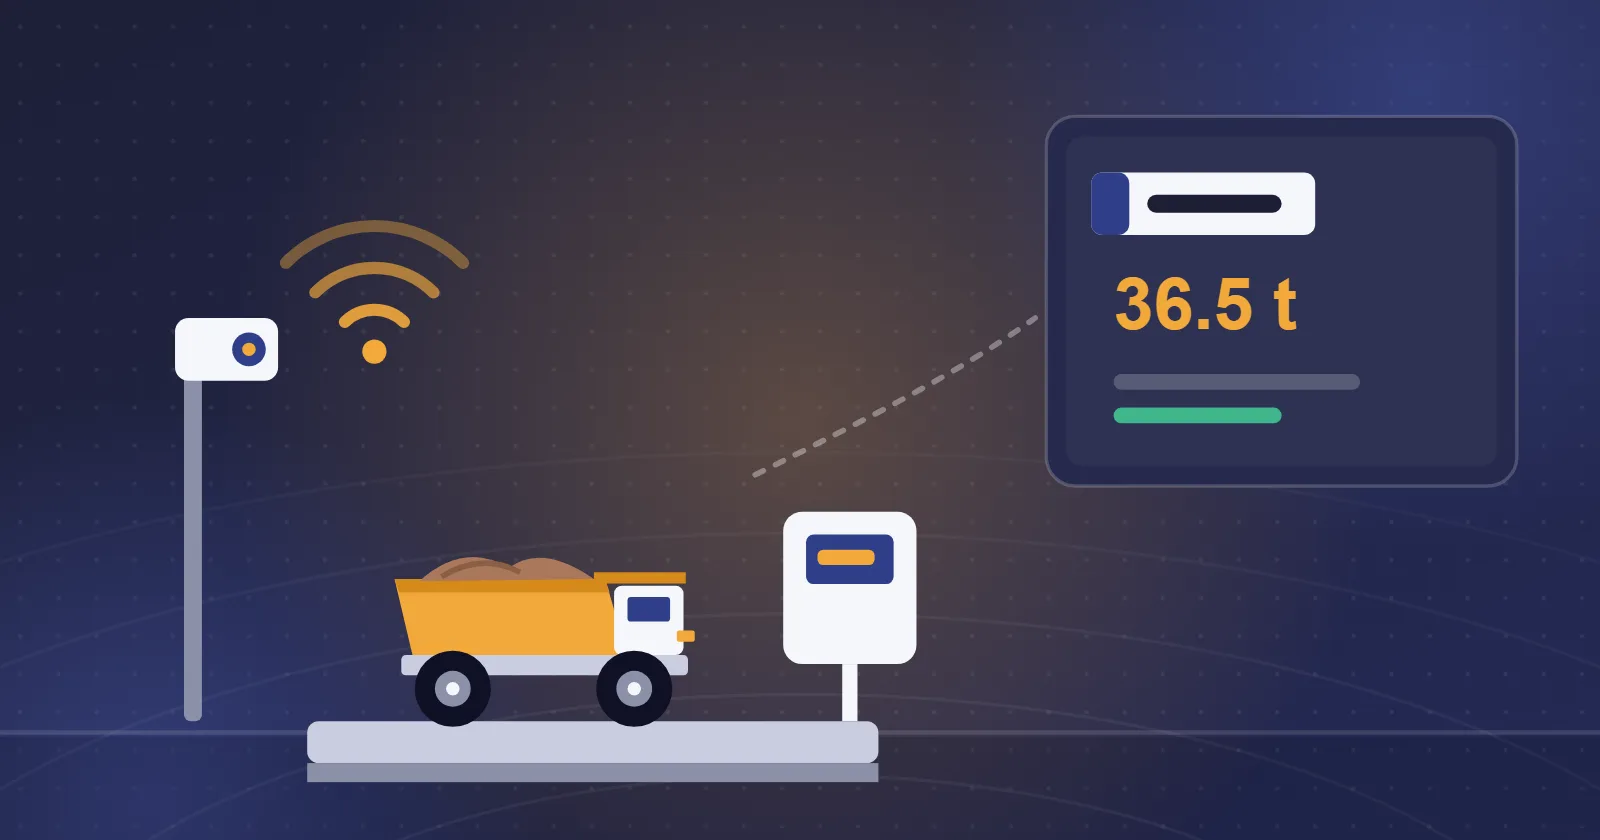
Calculating this indicator requires weight data from a weighbridge, a payload measurement system or other reliable equipment.
The acceptable range should also be set according to each machine model's specifications, safety requirements and operating conditions.
12. Haulage cost per tonne
One of the most important management indicators for evaluating the economics of haulage is the cost per tonne of material.
Formula:
Cost per Ton = total defined haulage costs ÷ tonnes hauled
These costs can include fuel, maintenance, tyres, labour and other related expenses.
For a valid comparison, the scope of costs included must stay the same across periods.
Comparing two haul routes on cost per tonne alone can also be misleading, because distance and elevation difference have a direct impact on cost.
Which KPI matters most to a mine manager?
The answer depends on the management role and the operational problem at hand.
| Role | Priority indicators |
|---|---|
| Operations manager | Tonnes per Hour, Cycle Time, Plan Compliance |
| Dispatch manager | Queue Time, Shovel Hang Time, Trips per Shift |
| Fleet manager | Utilization, Availability, Idle Time |
| Maintenance manager | Availability, maintenance downtime, MTBF |
| Finance and planning manager | Cost per Ton, Fuel per Ton |
| Loading manager | Payload Compliance, tonnes hauled |
A good dashboard should show how indicators trend over time alongside the details of each shift.
Why isn't looking at each KPI separately enough?
Fleet indicators depend on one another.
For example, cutting queue time may shorten cycle time, but if that comes from machines driving at unsafe speeds, the result is not acceptable.
Likewise, pushing utilization up without regard to the maintenance schedule and operators' rest can create other risks.
The main goal, therefore, should not be to optimise a single number at any cost, but to strike the right balance between production, cost, safety and equipment health.
The role of a dispatch system in monitoring fleet KPIs
Collecting data on every haul cycle by hand is time-consuming, especially at large mines, and prone to error.
Dispatch and fleet management systems record operational events, assignment status and machine stop and travel times, creating a sound basis for analysing performance indicators.
The BiSmart dispatch and fleet management system is one of Bistun Kavir Yazd's products in this field, focused on managing haulage operations, allocating the fleet and analysing haul cycle performance.
With reliable data and the required systems connected, indicators such as cycle time, queue time, utilization and other operational KPIs can be reviewed.
For indicators that depend on fuel and weight, the relevant data must also come from appropriate systems.
Conclusion
Measuring mining fleet KPIs is the foundation of data-driven decision-making in haulage.
Cycle time, queue time, idle time, utilization, availability and tonnes per hour are among the most important indicators of day-to-day equipment performance.
Alongside them, looking at fuel consumption, payload and haulage cost per tonne can make the link between operational performance and mine costs clearer.
The real value of KPIs becomes clear when managers use them to find bottlenecks, correct fleet allocation and evaluate the results of their decisions.
To discuss recording and analysing your mining fleet's operational indicators, talk to Bistun Kavir Yazd.