Increasing mine production does not always mean buying more haul trucks, adding shovels or expanding the fleet. In many mines, part of the existing capacity goes unused because of queues, non-productive stops, poor machine assignment, equipment breakdowns and slow decisions.
In these situations, digitalisation can uncover hidden losses in the extraction and haulage cycle without directly adding machines. Dispatching, fleet management, equipment condition monitoring, fuel management and production dashboards help mine managers see the real state of operations as it happens and make more precise decisions.
That said, higher productivity is not the result of installing a few sensors or building a dashboard. Technology creates value when it targets a specific bottleneck, its indicators are measured before implementation and the data it produces leads to operational action.
Which indicators measure mine productivity?
Terms such as higher output, higher efficiency and better productivity are often used interchangeably, although each means something different.
A mine's tonnage may rise while the number of machines or working hours also increases. In that case, you cannot conclude that fleet productivity has improved. To evaluate the effect of digitalisation, several operational indicators must be reviewed together.
Tonnes per hour
Tonnes per hour (TPH) shows how much material the fleet, or part of the operation, moves each hour.
It can be calculated for:
- The whole fleet
- Each shovel or loader
- Each haul route
- Each shift
- Each contractor
- Each material type
A higher TPH may result from shorter queues, shorter cycle times, more trips or less equipment downtime.
Cycle time and trip count
Cycle time is the full duration of a haul cycle, from when the truck is ready to be loaded until it returns to the next point after dumping.
The cycle usually includes:
- Waiting to be loaded
- Spotting at the loading position
- Loading
- Hauling
- Waiting to dump
- Dumping
- Empty return
Shortening each stage can increase the number of trips in a shift. Cycle time must not, however, be reduced through unsafe speeds or by removing operational controls.
Utilisation and availability
Availability shows how much of the scheduled time a machine was technically ready to work.
Utilisation shows how much of that ready time was actually used for productive work.
A haul truck may be available but go unused because there is no assignment, a queue, a shovel stop or poor assignment. In that case availability is good but utilisation stays low.
Plan compliance
Plan compliance shows how closely the mine's actual performance matches the production plan.
It can look at:
- Planned versus actual tonnage
- Type of material mined
- Correct load destination
- Number of trips
- Performance of each working face
- Distribution of the fleet across loading equipment
Digitalisation is valuable when it reveals the gap between plan and actual and shows the cause of the deviation.
Cost per tonne and fuel per tonne
Lower absolute fuel use is not always a sign of improvement. If tonnage has also fallen, using less fuel is not a positive result.
That is why fuel consumption is best calculated per tonne of material moved:
Fuel per tonne = total fuel consumed ÷ total tonnes moved
The same logic applies to operating cost:
Cost per tonne = total haulage operating cost ÷ total tonnes moved
These two indicators help mine managers evaluate the real effect of operational changes.
How does digitalisation increase production productivity?
Digitalisation affects production through several paths. These paths are not independent and usually influence one another.
For example, better truck assignment can shorten queues. Shorter queues reduce cycle time and increase the number of trips per shift. As a result, tonnage rises without adding a new machine.
Optimal truck-to-shovel assignment
In manual dispatching, machines are usually assigned by radio, the dispatcher's experience or a fixed plan.
Mine conditions, however, change during the shift:
- A shovel stops.
- A haul road gets congested.
- The crusher goes offline.
- A queue builds up at one point.
- A haul truck breaks down.
- The load destination changes.
A dispatching system can review position, machine status, queue length, loading equipment capacity and the production plan, and suggest a better assignment for each truck.
The goal of this assignment is to balance the number of trucks against shovel capacity.
If too many machines are sent to one shovel, queue time rises. If there are too few, the shovel waits and shovel hang time goes up.
Shorter cycle time
A fleet management system can record each component of cycle time separately, which helps identify why cycles are getting longer.
For example, longer cycle times may be caused by:
- Queues at the loading point
- Long loading times
- Poor routes
- Stops along the route
- Queues at the crusher
- Dumping delays
- Returning via an unauthorised route
- Destination changes
Without separating these stages, managers only know the cycle has got longer; they cannot see the exact cause.
Once the bottleneck is identified, the right action can be taken, such as changing assignments, correcting routes, coordinating with the crusher or moving the waiting area.
Less idle time
Idle time is when the machine's engine is running but no productive work is being done.
Some idling is unavoidable, such as brief stops for safety or controlled waiting in a queue. Long and repeated stops, however, can point to weak planning.
Tracking and fleet management systems can show:
- When the machine stopped.
- Where the stop occurred.
- Whether the engine was on or off.
- Whether the stop was due to a queue, a breakdown or no assignment.
- In which shift or on which route the pattern repeats.
Reducing idling not only increases the machine's productive time but also cuts fuel use and engine wear.
Higher equipment availability
Smart maintenance relies on monitoring operating hours, service status, ECU faults and failure symptoms.
If maintenance only happens after a breakdown, a machine may drop out at the wrong moment and disrupt the production plan.
Using real data, you can:
- Schedule services by operating hours.
- Identify recurring failures.
- Choose the right time for repairs.
- Prepare parts before the shutdown.
- Compare the performance of similar machines.
Higher availability does not mean eliminating breakdowns entirely; the aim is fewer sudden stops and maintenance that can be planned.
Aligning operations with the production plan
In many mines, the production report is prepared at the end of the shift or day. It is useful for analysing the past but does not allow operations to be corrected quickly.
A real-time dashboard can show deviations from the plan during the same shift:
- Tonnage below target
- Material sent to the wrong destination
- Fewer trips
- A stopped working face
- Unbalanced use of the fleet
- Growing queues on a route
This information lets the operations manager take corrective action before the shift ends.
Lower fuel per tonne
Machine fuel consumption depends on several factors:
- Payload
- Road gradient
- Speed
- Idling
- Road quality
- Number of stops
- Machine condition
- Operator behaviour
A smart system should review fuel consumption alongside operating conditions. A consumption figure on its own does not reveal the cause of waste.
For example, higher consumption may result from overloading, a long route, frequent stops or a technical fault. Matching fuel data against assignments, routes and tonnage can point to the likely cause.
What exactly does a 14% efficiency gain mean?
Some digitalisation projects report figures such as a 14% gain in efficiency or output. These figures can only be evaluated if the indicator and calculation method are clearly defined.
A 14% gain may refer to any of the following:
- Higher tonnage
- Higher tonnes per hour
- More trips
- Shorter cycle time
- Higher utilisation
- Better plan compliance
- Lower cost per tonne
These results do not mean the same thing.
For example, a 14% increase in tonnage may be due to longer working hours, extra machines or a change of working face. In that case, the whole change cannot be attributed to the smart system.
Defining the KPI being measured
Before publishing any result, it should be clear:
- Exactly which indicator was measured?
- What is the unit of measurement?
- What were the before and after values?
- Does the result apply to the whole mine or part of the operation?
- Were the conditions comparable?
Without answers to these questions, "higher efficiency" tells the reader very little.
Project baseline
The baseline is the state of operations before the system was introduced.
To set the baseline, it is best to collect data over several shifts or weeks. Using a single day may skew the result because of breakdowns, weather or a change in plan.
The baseline can include these indicators:
- Average cycle time
- Queue time
- Idle time
- Trips per shift
- Tonnes per hour
- Utilisation
- Availability
- Fuel per tonne
- Cost per tonne
System and machine scope
The project result must match its scope.
If the system was installed on only part of the fleet, the result cannot be attributed to the whole mine. It should also be clear:
- How many haul trucks were in the project?
- How many shovels or loaders were reviewed?
- How many haul routes were covered?
- Which modules were active?
- Were fuel, weight or maintenance data also used?
Evaluation period
Short-term results may be influenced by training, extra management attention or temporary changes in operator behaviour.
For a lasting evaluation, data should be collected over a suitable period, with before and after conditions as similar as possible.
Factors affecting the result
The following factors can affect production:
- More or fewer machines
- Changes to haul routes
- A change of mining face
- Road quality
- Changes of operators
- Changes to working hours
- Weather
- Crusher stops
- Major overhauls
- Changes to the production plan
That is why a 14% gain in one project is not necessarily repeatable in every mine. Each mine's result depends on its bottleneck, baseline and the quality of project execution.
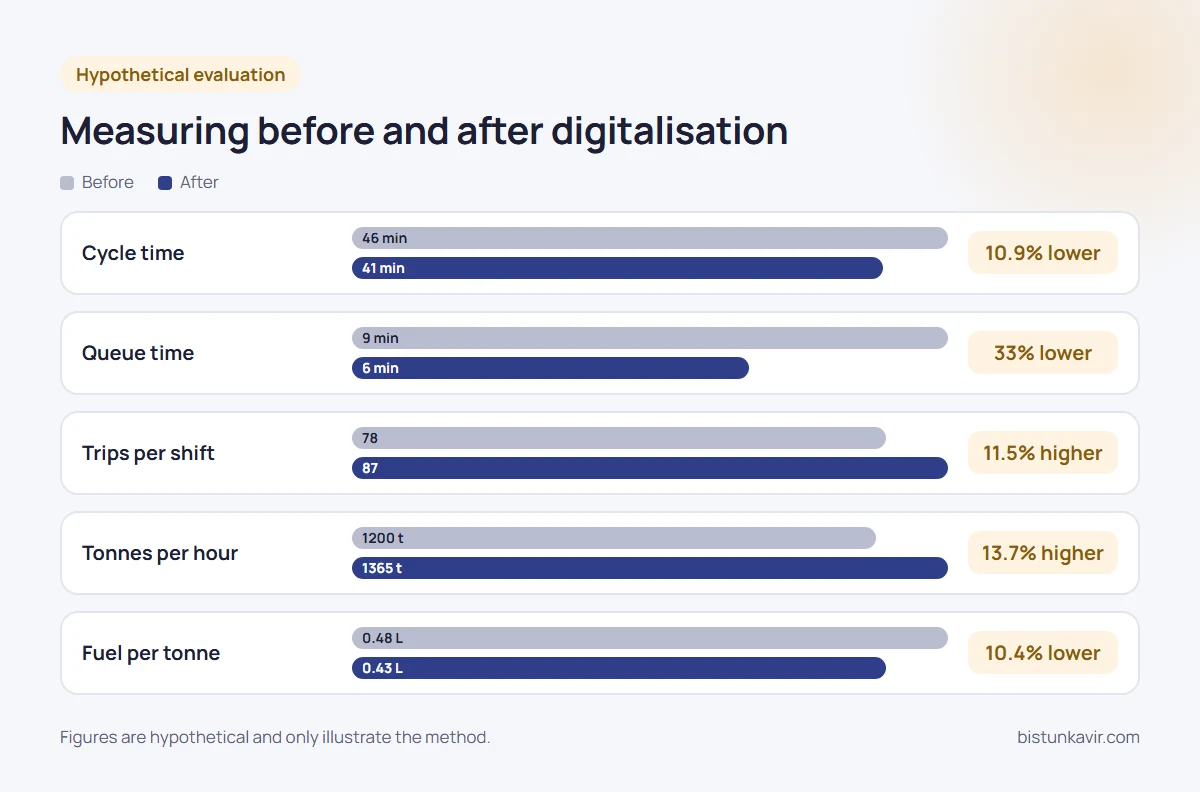
An example method for measuring before and after digitalisation
The table below is a hypothetical example to illustrate the evaluation method and is not the result of a real project.
| KPI | Before | After | Change |
|---|---|---|---|
| Average cycle time | 46 minutes | 41 minutes | 10.9% lower |
| Queue time | 9 minutes | 6 minutes | 33% lower |
| Idle time | 18% | 14% | 4 percentage points lower |
| Trips per shift | 78 | 87 | 11.5% higher |
| Tonnes per hour | 1,200 t | 1,365 t | 13.7% higher |
| Fuel per tonne | 0.48 L | 0.43 L | 10.4% lower |
In this example, the productivity gain does not come from a single factor. Shorter queues, better assignment, fewer stops and more trips together raised TPH.
For an accurate calculation, check whether the number of machines, working hours and equipment capacity stayed the same across both periods.
What limits the results of digitalisation?
Not every digitalisation project achieves the same result. Technology quality is only one factor in success.
Poor data quality
If GPS, sensors, device clocks or machine status records are inaccurate, the analysis will not be reliable either.
Common problems include:
- Incomplete data
- Lost connections
- Uncalibrated sensors
- Incorrect manual entries
- Inconsistent equipment naming
- Incorrectly defined states
- Clock differences between devices
Data quality and ownership should be defined before building dashboards.
Weak communication network
In a mine, part of the route may lack good coverage. If the system only works online, cycle data will be incomplete.
A suitable solution should store data locally and resend it once the connection is restored.
Poorly set KPIs
Choosing the wrong KPI can drive the wrong behaviour.
For example, focusing only on trip counts may push operators to drive faster or load less carefully. KPIs must balance production, safety, cost and equipment health.
Operator resistance
If staff see the system only as a tool for monitoring individuals, the necessary cooperation may not develop.
Operators should know:
- What data is collected.
- What the data is used for.
- How alarms are reviewed.
- That route and machine conditions are considered in evaluations.
- How their feedback is used to tune the system.
No one responsible for action
A dashboard alone does not increase productivity.
For each alarm or deviation, it should be clear:
- Who reviews it?
- How quickly must they respond?
- What actions are permitted?
- How is the result recorded?
- When is the issue escalated?
Without this process, the system just produces more data.
Simultaneous changes to the fleet or site conditions
If routes are improved, new machines are added or equipment is overhauled at the same time as the system is deployed, separating the contribution of each factor becomes difficult.
That is why the evaluation methodology should record external factors.
How is the return on investment of digitalisation calculated?
Return on investment depends on the cost of implementing the system and the economic benefit of improved operations.
Project costs
Costs may include:
- On-machine equipment
- GPS and telemetry
- Software
- Servers
- Communication infrastructure
- Installation
- Integration
- Training
- Support
- Maintenance
Economic benefits
Benefits can come from:
- More tonnage with the current fleet
- Less idling
- Lower fuel per tonne
- Less waiting time
- Higher availability
- Fewer sudden breakdowns
- Less reporting delay
- Fewer unnecessary trips
- Better use of equipment
For example, if shorter cycle times allow a few more trips per shift, the value of the extra tonnage should be calculated. Project costs must then be subtracted from the benefit.
The payback period is not the same for every mine. Fleet size, fuel price, ore value, operational bottlenecks and project scope all affect the result.
Which bottleneck should mine digitalisation start with?
A project should not start by choosing a technology. First, identify where the biggest losses occur in the operation.
Long queues at loading or dump points
Suitable solutions:
- Dispatching system
- Queue time analysis
- Fleet balancing
- Destination capacity control
High idling
Suitable solutions:
- Fleet tracking
- Machine status detection
- Stop analysis
- Classifying the causes of idling
Frequent equipment breakdowns
Suitable solutions:
- Condition monitoring
- Recording operating hours
- Service scheduling
- Analysing recurring faults
High fuel consumption
Suitable solutions:
- Fuel management
- Fuel per tonne analysis
- Reviewing routes, idling and payload
- Reconciling refuelling and consumption
Tonnage discrepancies
Suitable solutions:
- Payload monitoring
- Smart weighbridge
- Matching trips and weights
- Controlling underloading and overloading
Gaps between plan and actual performance
Suitable solutions:
- Production dashboard
- Plan vs actual recording
- Real-time reporting
- Root-cause analysis of deviations
The best pilot project is usually one with a clear economic problem, accessible data and a measurable result.
Conclusion
Digitalisation increases mine productivity when it identifies losses in the existing cycle and turns them into operational action.
Better truck assignment, shorter queues, controlled idling, shorter cycle times, higher availability and closer alignment with the production plan can all increase the fleet's real capacity.
The percentage improvement is not the same for every mine, though. Figures such as a 14% efficiency gain are only valid and useful when their KPI, baseline, scope, time period and external factors are clearly defined.
The measure of success is not the number of sensors, dashboards or alarms. Success comes when cost per tonne, fuel per tonne, utilisation or other target KPIs improve measurably.
To get started, identify the main operational bottleneck, record the baseline and run a limited pilot with clear KPIs.
Frequently asked questions
How much does mine digitalisation increase production?
The increase depends on the operational bottleneck, baseline, fleet size and project scope. A smart system can raise production when factors such as queues, idling, poor assignment or equipment breakdowns are limiting existing capacity. No fixed percentage can be guaranteed for every mine.
Is a 14% efficiency gain achievable for every mine?
No. A 14% gain may be the result of a project under specific conditions. To judge whether it can be repeated, the KPI, number of machines, route, time period and simultaneous changes must be known. One mine's result cannot be generalised to another without reviewing the baseline.
What is the most important fleet productivity KPI?
No single KPI is enough for every mine. Cycle time, queue time, utilisation, availability, tonnes per hour and cost per tonne should be reviewed together. The main KPI depends on the bottleneck the digitalisation project is meant to solve.
What role does dispatching play in increasing production?
Dispatching reduces queues and waiting time by balancing trucks across shovels and dump destinations. It can also change machine assignments when equipment fails or queues grow. The results usually show up in cycle time, trip count and tonnes per hour.
What is the difference between utilisation and availability?
Availability shows how much of the scheduled time a machine was technically ready to work. Utilisation shows how much of that ready time was actually used for productive work. A machine can be ready but go unused because of a queue or no assignment.
How does digitalisation reduce cycle time?
By recording the time of each stage of the cycle, the system shows where delays occur. Unnecessary time can then be cut through better assignment, route control, queue management or destination changes. Cycle time should be reduced without increasing safety risk or putting unauthorised stress on equipment.
How is the return on investment of digitalisation calculated?
First, the cost of hardware, software, installation, network, training and support is calculated. Then the economic value of extra tonnage, less idling, lower fuel consumption and fewer breakdowns is estimated. The payback period comes from comparing project cost with net benefit.
Which part of the mine should a pilot start with?
Choose an area with a clear bottleneck, accessible data and a measurable result. For example, a busy haul route with a few trucks and one shovel can suit a dispatching pilot. Before and after KPIs should also be defined before starting.