
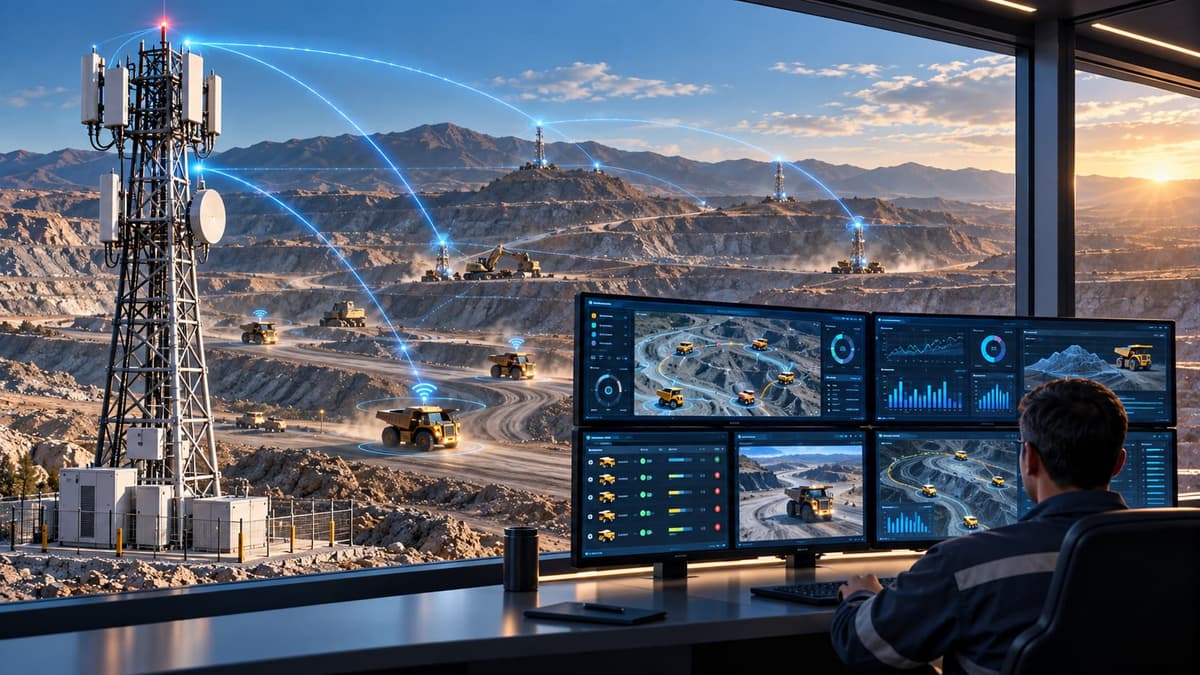
- Operating hours
- Non-productive stops
- Utilization
- Availability
- Fuel consumption analysis
- Performance trend
Why does machine performance monitoring matter in a mine?
In an active mine, decisions on machine allocation, shift planning, maintenance and fleet expansion have a direct financial impact. A dump truck may be running for many hours, yet spend part of that time waiting for loading, standing unproductively or traveling empty. Conversely, a machine with fewer working hours is not necessarily inefficient.
When data is kept in silos without shared indicators, it is hard to find the cause of performance differences. VPMS provides a platform for collecting related data, calculating agreed indicators and comparing performance across time periods. The goal is to ask sharper questions, not to automatically attribute every stop to a specific cause.
VPMS helps answer these questions
- How much of its available time has each machine been active?
- During which periods have stops increased?
- Why do similar machines not perform the same?
- What trend does fuel consumption show alongside operation?
What is VPMS and what does it do?
VPMS stands for Vehicle Performance Monitoring System. It receives equipment operating status from sources such as telematics systems, compatible control and data-logging units, trackers or project-defined inputs, and uses the validated data to display status, analyze trends and calculate indicators.
The main difference between VPMS and simple data display lies in this analytical layer. Recording whether an engine is on or off is raw data; comparing engine-on time with activity time and classifying stops gives a more accurate operational understanding of how equipment is used. Calculating “productive work” correctly requires an operational definition and a reliable data source.
Raw data vs. analysis
- Raw data: engine on or off
- Analysis: engine-on time vs. effective activity time
- Analysis: classifying stops as planned, operational waiting or technical
- Analysis: comparing equipment of the same class under similar conditions
Core capabilities of Bistun VPMS
The exact scope of each indicator depends on the machine type and the data available in the project.
Operating status and hours monitoring
Shows machine activity across different periods and the operating history. Each type of hour should be clearly defined from the start so that “engine-on hours” are not treated as “effective working hours.”
Stop and unproductive time analysis
Records and analyzes stops and unproductive periods by machine, shift or time period and, where enough data exists, distinguishes between planned stops, operational waiting and technical stops.
Equipment utilization (Utilization)
Shows what share of the equipment’s defined time or capacity was used. By recording the formula agreed for the project, VPMS enables more reliable comparison of machine groups.
Availability (Availability)
A measure of whether the machine could be used in the period of interest; it should not be confused with actual utilization. It can be relied on only when availability status and technical stops are recorded correctly.
Fuel consumption alongside operation
When reliable data sources are connected, consumption trends, comparisons between similar machines and abnormal changes are displayed. Indicators such as liters per hour or liters per ton require reliable operating and production data.
Equipment comparison and trend analysis
Compares machines of the same class under similar conditions and tracks indicator changes across consecutive shifts, taking into account machine age, type of assignment, route and data quality.
Key performance indicators for a mining fleet
Each indicator should have a defined formula, data source, time period and approving owner to prevent differing interpretations in reports.
- Operating hours (Operating Hours)
- The basis for reviewing fleet workload and comparing shifts.
- Idle and unproductive time (Idle Time)
- Times when the machine is running but not doing effective work.
- Utilization (Utilization)
- The share of time or capacity used, based on an agreed denominator.
- Availability (Availability)
- Whether the equipment is ready for work in the period of interest.
- Fuel consumption (Fuel Consumption)
- Consumption trends and comparison of similar equipment using reliable data.
- Performance trend (Performance Trend)
- How indicators change over time and after corrective actions.
Note: In projects where production, trip or tonnage data is also available, the analysis extends to ratios such as haulage per hour or consumption per ton.
How does VPMS differ from GPS and dispatching systems?
GPS tracking and Bitatracker
Answers questions about a machine’s location, route traveled, speed and when it moved or stopped: “Where has the machine been?”
VPMS
Adds an analytical layer for evaluating how machines perform: “How much of the machine’s time and capacity was actually put to use?”
BiSmart
Focuses on managing haulage and dispatching operations, including the load and haul cycle, equipment allocation and bottleneck identification.
Note: These systems are not competitors or substitutes for one another. With validated integration, location data, equipment performance and haulage operations come together for a more comprehensive analysis.
What value does VPMS create for a mine?
Better use of existing fleet capacity
Before buying a new machine, determine how much unused capacity the current fleet has; underused equipment, frequent stops and differences in operating patterns are identified.
Support for managing consumption and cost
Viewing consumption alongside operation clarifies the context behind rising costs. The system does not by itself guarantee lower consumption, but it provides the information needed to define and evaluate waste-reduction measures.
Information support for maintenance
Operating hours and changes in performance trends help prioritize equipment inspections. VPMS does not replace a maintenance management system or specialist diagnostics; it complements them.
Transparency in contractor and shift performance
Comparable reports on working hours, stops and agreed indicators provide the basis for a more precise technical discussion with the contractor, rather than judging by a single number.
What does the machine performance management dashboard show?
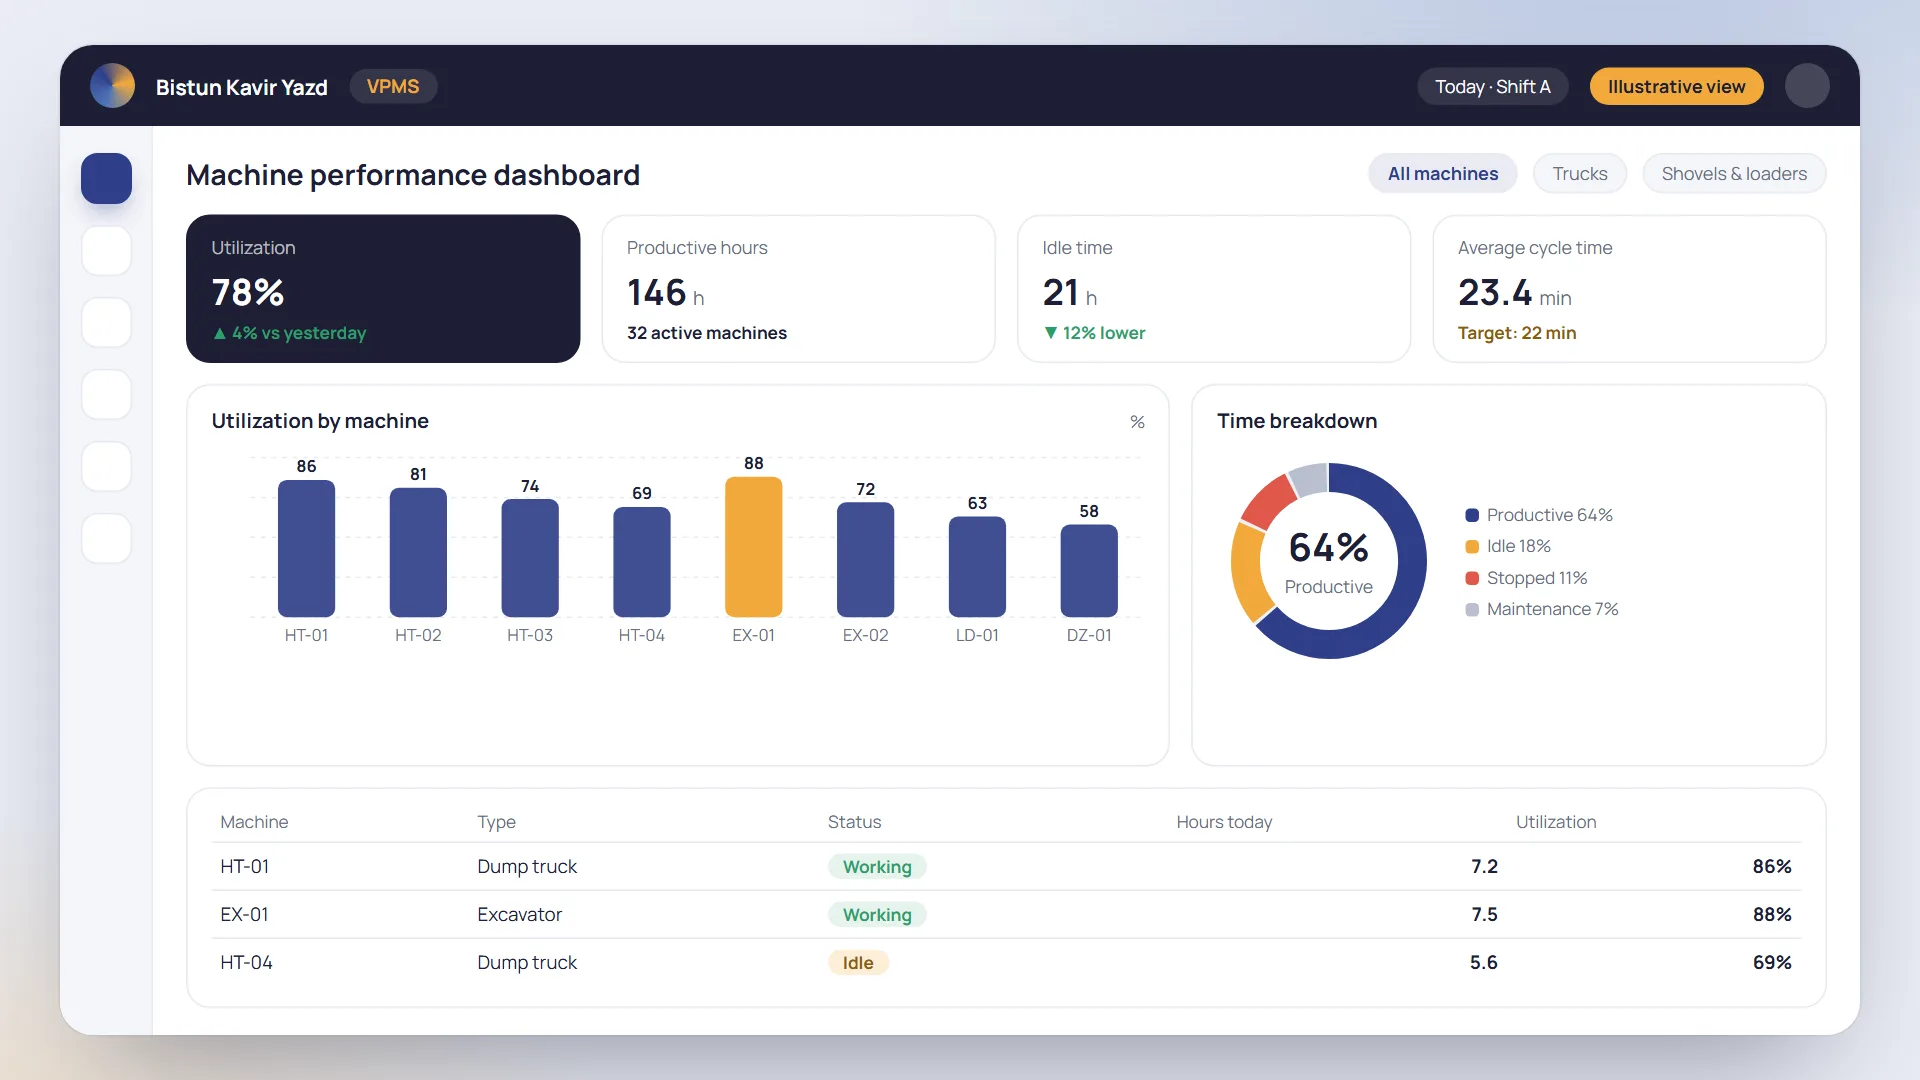
The VPMS dashboard offers a centralized view of the fleet, the latest received data, operating hours, stop trends and selected indicators. Data can be reviewed by machine type, equipment ID, shift, contractor or time period, provided these are defined in the project structure.
The dashboard is most valuable when you can drill down from the fleet-wide view to each machine’s details; for example, first seeing the change in a machine group’s Utilization, then reviewing the stop or operating history of each unit.
Configurable filters
- Machine type and equipment ID
- Shift and time period
- Contractor
- Machine group and assignment
Sample VPMS use cases in a mine
These examples illustrate how the analysis is applied and do not represent guaranteed results from the system.
Scenario one: two dump trucks with similar engine-on hours
Two dump trucks had the same engine-on time at the end of a shift, but one experienced more waiting. Reviewing operation, stops and haulage data together shows whether the difference came from the assignment pattern, route or a process bottleneck.
Scenario two: a loader’s rising fuel consumption
A simple consumption report does not identify the cause; but with operating hours, idle time and activity type, the changes are reviewed together and, if needed, a technical assessment is requested.
Scenario three: assessing the fleet’s real capacity
If a significant share of planned time has not turned into activity, the operational, maintenance or organizational causes are examined first, and only then is a decision made on new investment.
Which machines can be monitored with VPMS?
Depending on project conditions, the system can be evaluated for dump trucks, shovels, excavators, loaders, graders, bulldozers and operational vehicles. Identical parameters cannot be obtained from all machines, because models, build years, controllers and data interfaces differ; the list of monitorable data for each group is defined in the technical study.
Implementation starts with identifying data sources. Some machines provide data through installed equipment, while others need an industrial tracker, a telematics unit or a supplementary sensor. Communication quality, temporary data storage during outages, system clock accuracy, user access levels and server location are also determined during design.
Equipment that can be assessed
- Dump trucks and shovels
- Excavators and loaders
- Graders and bulldozers
- Operational vehicles
Stages of deploying VPMS in a mine
- 1
Understanding operations and defining objectives
Review the fleet mix, shifts and priorities, and define measurable objectives and the required indicators.
- 2
Data source assessment and technical design
Determine the parameters that can be acquired, supplementary equipment, the data transmission architecture and KPI definitions.
- 3
Installation, configuration and pilot
A trial run on a group of machines, comparing output against operational reality and reliable records.
- 4
Training, rollout and continuous improvement
Extend to the target fleet, train users and define a baseline for measuring the impact of corrective actions.
Connecting VPMS to other smart mining systems
With technical integration and reliable shared data, combined analyses become possible, such as consumption per ton or comparing operation with the haul cycle.
Why Bistun for mining machine performance monitoring?
VPMS is useful when it is designed around the realities of mining operations and the mine’s infrastructure constraints. Bistun Kavir’s experience in smart mining, fleet management and operational systems makes it possible to examine the problem from the software, equipment and mining process perspectives.
Our approach is to define the problem and measurable indicators before selecting equipment and building dashboards; the aim is a reliable picture of machine performance for identifying issues, prioritizing actions and measuring real results.
Cost estimates depend on these factors
- Number and types of machines
- Access to technical data and supplementary equipment
- Communication infrastructure and number of users
- Dashboard scope and integration level
Frequently asked questions about VPMS
Is VPMS the same as a GPS tracker?
No. GPS mainly records location and movement, whereas VPMS uses suitable data to analyze operation, stops and performance indicators.
Can VPMS be used with all machine models?
Deployment is assessed for different equipment groups, but the data that can be acquired and the level of analysis depend on the machine model, compatible interfaces and existing equipment.
Is new hardware required?
Not always. Existing data sources are assessed first, and supplementary equipment is proposed if more parameters are needed.
Does the system show fuel consumption?
If fuel data is received from a reliable, compatible source, consumption trend analysis and equipment comparison are possible.
Does VPMS predict machine failures?
VPMS is for performance monitoring and indicator analysis. Failure prediction requires specialist data, a validated analytical model and a separate project assessment.
What is the difference between Availability and Utilization?
Availability refers to the equipment being ready for work, and Utilization to how much it is used according to the indicator definition; the two are not necessarily equal.
What happens to data if the connection drops?
Temporary storage, recovery and resending depend on the equipment and the deployment architecture, and are defined before implementation.
Does VPMS connect to Bismart and Bitatracker?
The possibility of integration is assessed based on technical interfaces, data quality and project needs.
What information is needed for a quote and demo?
The number and types of machines, main models, connectivity conditions, available data sources and management priorities.
Your mine could be our next project
Our consultants are ready to answer every question on your path to a smarter mine.
Yazd, Motahari St., Eqbal Science & Technology Park, Al-Zahra Building, DIACO Mining Technology Development Center
Request an initial mine review
Three short steps — it takes less than a minute.
Step 1 of 3 · Contact details